⇑ 64 65 66 67 68 69 70 71 Page 72 73 74 75 76 77 78 79 ⇓
8-8
¶ 1 Leave a comment on paragraph 1 0 Merchants (R1), (B1.2.2), (R2), and (B1.2.1.2) had a markedly higher frequency of debts than the rest. But rather than just eyeballing the similarity between the merchants, we can use a statistical method called Pearson Product Moment34 to compare the patterns of the full 131-merchant sample. According to this method, for each merchant we plot the sum of grain, cattle and horse, and real-estate deals on the x-axis against their number of owed claims on the y-axis (figure 10).
¶ 2
Leave a comment on paragraph 2 0
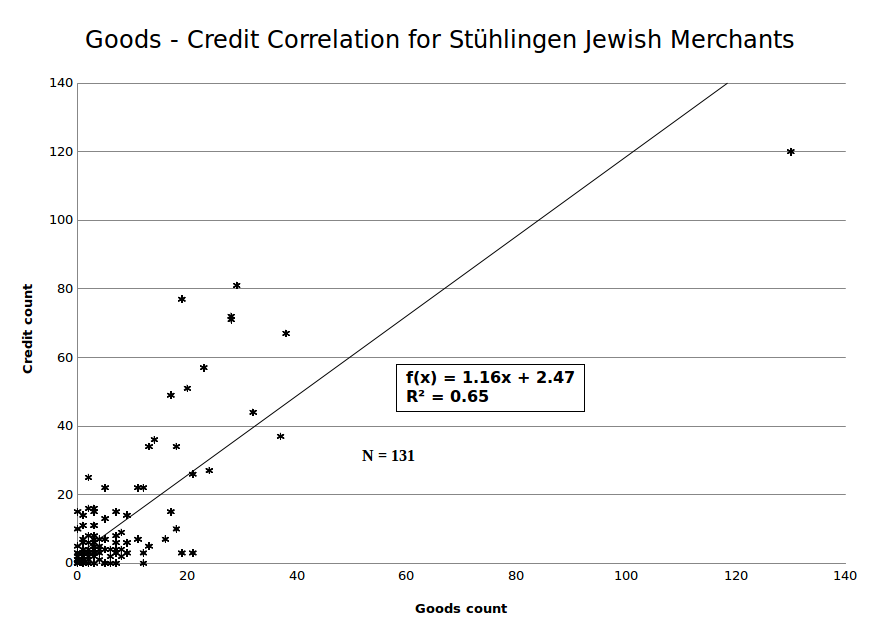 Figure 10. Correlation between goods sold and credit claims collected per merchant.
¶ 3 Leave a comment on paragraph 3 0 With a sample size of 131 and a Pearson Product Moment R2 = 0.65, the likelihood of falsely rejecting the null hypothesis (no correlation exists between goods sold and credit extended) is significantly less than one in one hundred.35 In other words, it is practically certain that the total count of collected claims is highly proportional to the number of sales. A statistically savvy reader might object that Marum, the super salesman, distorts the statistics. True, but even if we repeat the calculation, omitting Marum, we still get a resulting R2 = 0.616, which is still highly significant, better than 99%.
34Pearson et al., Note on Regression.
35Cohen, “Statistical Power Analysis,” 93.

Comments
0 Comments on the whole Page
Login to leave a comment on the whole Page
0 Comments on paragraph 1
Login to leave a comment on paragraph 1
0 Comments on paragraph 2
Login to leave a comment on paragraph 2
0 Comments on paragraph 3
Login to leave a comment on paragraph 3
0 Comments on paragraph 4
Login to leave a comment on paragraph 4
0 Comments on paragraph 5
Login to leave a comment on paragraph 5